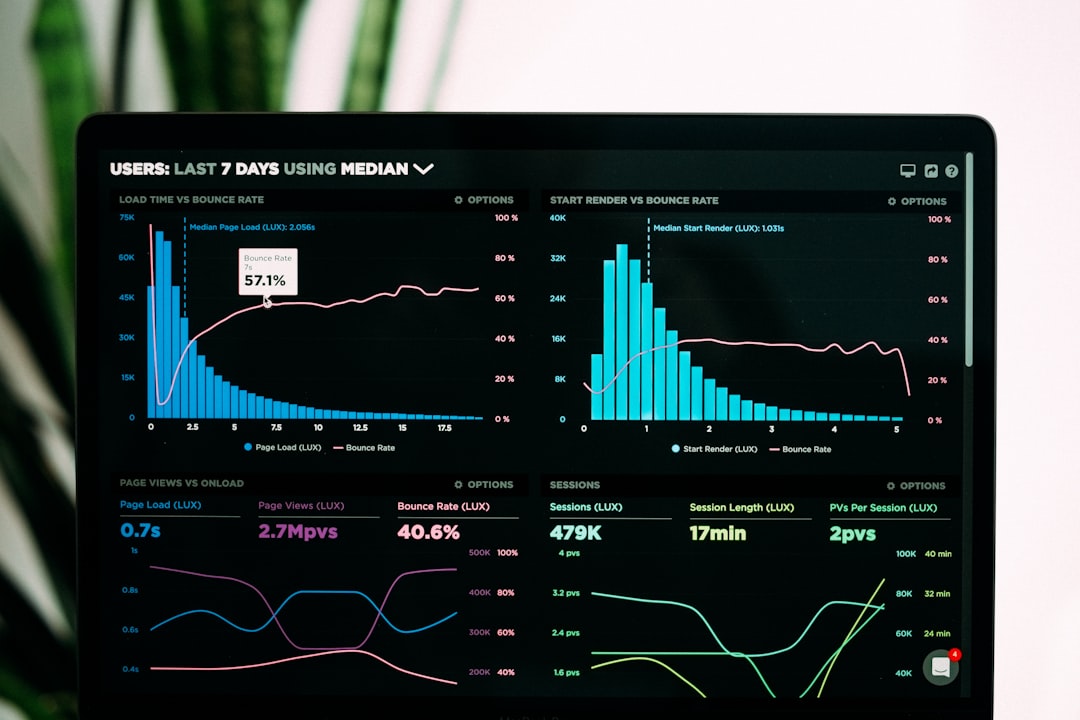
You refresh your analytics dashboard, see a 1.8% conversion rate, and wonder: is that good? Is it terrible? Should you be panicking or celebrating with a slice of pizza?
If that moment sounds familiar, you're not alone. Conversion rate is one of those metrics that looks simple on the surface — sales divided by visitors — but the context around it changes everything. And in 2024, the platform you're selling on plays a bigger role in that number than most people realize.
Let's walk through what the ecommerce platform conversion rates 2024 data actually shows, why your platform choice matters more than you might expect, and what you can do about it starting today.
What "Average" Conversion Rate Actually Means in 2024
First, a quick sanity check on benchmarks. Industry surveys and aggregated platform data for 2024 generally put the average ecommerce conversion rate somewhere between 1.5% and 3.5%, depending on the source. IRP Commerce's 2024 benchmarks put the overall average closer to 1.82% across most retail categories. Shopify's own published data has historically cited 1.4% as a broad average across its merchant base, while stores in the top quartile hit 3.2% or higher.
Here's the catch: those numbers pool together a $50,000-a-year hobby store and a $5M brand running full-time paid ads. The averages are useful as a rough compass, not a report card.
What matters more is your category and your traffic source. A store selling handmade ceramics at $180 per piece will naturally convert at a lower rate than a store selling $12 phone cases. Visitors who arrive from email campaigns convert at roughly 4–5%, while cold paid social traffic often lands below 1%. Same store, wildly different numbers.
So before you benchmark yourself against anything, segment your own data first. Pull your conversion rate by traffic source, by device, and by product category. That's where the real story lives.
How Your Platform Choice Influences Conversion
Here's something that doesn't get talked about enough: the platform you build on has a measurable impact on your conversion rate — not because of magic, but because of speed, checkout friction, and mobile experience.
Page load time is the clearest lever. Google's research has consistently shown that a one-second delay in mobile load time can reduce conversions by up to 20%. In 2024, Core Web Vitals are baked into how Google ranks pages, which means a slow storefront hurts you twice — once in search rankings and again when frustrated visitors bounce before buying.
Hosted platforms like Shopify, BigCommerce, and Wix handle server infrastructure for you, which means their baseline performance is usually solid out of the box. A standard Shopify store with a lightweight theme will typically score well on Lighthouse without much tuning. WooCommerce on shared hosting, on the other hand, can easily slip into 4–6 second load times if nobody's watching the plugin count. If you're running WooCommerce, this guide on optimasi performance Node.js aplikasi covers similar principles for backend optimization that can help reduce server response times.
Checkout friction is the second big factor. Shopify's accelerated checkout (Shop Pay) has published data showing up to a 50% higher conversion rate compared to guest checkout on the same store. That's not a platform ad — it's a reminder that reducing the number of form fields and clicks between "add to cart" and "order confirmed" directly moves the needle.
Headless setups — where you decouple your frontend from your commerce backend — can push performance even further, but they come with real engineering overhead. For most small stores doing under $500K in annual revenue, a well-configured hosted platform will outperform a poorly maintained headless build every single time.
The 2024 Numbers by Platform (What We Actually Know)
Hard, audited, platform-by-platform conversion rate data is genuinely hard to come by because most platforms don't publish it. What we have is a mix of third-party studies, merchant surveys, and aggregated analytics reports.
A 2024 study by Littledata, which analyzes anonymized data from thousands of Shopify stores, found the median conversion rate for Shopify merchants at around 1.4%, with the top 20% of stores converting at 3.6% or above. Their data also showed that stores using Shopify Payments (native checkout) converted about 18% better than stores routing through a third-party payment gateway — again, friction matters.
BigCommerce merchants in the same Littledata dataset showed a median closer to 1.7%, which the report attributed partly to BigCommerce's customer base skewing toward slightly more established mid-market brands with better-optimized stores.
WooCommerce data is harder to aggregate cleanly because the platform is self-hosted and wildly variable. Merchants who invest in performance optimization — good hosting, image compression, caching — can absolutely compete. Those who don't often lag behind by a full percentage point or more. For WooCommerce stores looking to improve, plugin WordPress terbaik untuk website bisnis can help streamline your setup.
The honest takeaway? The platform sets a ceiling and a floor, but your execution determines where you land in between.
Three Things You Can Do Today to Improve Your Rate
Okay, enough benchmarking. Here's where you actually move the number.
1. Run a real checkout audit — as a customer. Open an incognito window, add something to your cart, and try to buy it. Time yourself. Count the clicks. Note every moment of hesitation. Most store owners haven't done this in months, and small friction points — a confusing coupon field, a missing trust badge, a payment method that's not there — quietly kill conversions every day. Fix the one thing that annoyed you most.
2. Check your mobile speed score right now. Go to PageSpeed Insights (pagespeed.web.dev), drop in your store URL, and look at your mobile score. If it's below 50, you have a performance problem worth fixing before running another ad. Common culprits: uncompressed images, too many third-party scripts, and a theme that wasn't built with speed in mind. Even getting from a 45 to a 65 can meaningfully lift conversions.
3. Segment your conversion rate by traffic source. If you're not already doing this in Google Analytics 4 (or whatever analytics tool you use), set it up today. You might discover that your SEO traffic converts at 2.8% while your TikTok traffic converts at 0.6%. That doesn't mean abandon TikTok — it means you need a better landing page for that audience, or you need to adjust your expectations about what TikTok traffic is actually worth to you right now.
None of these require a platform switch or a developer. They require about two hours and honest attention.
A Quick Example: What a 0.5% Lift Is Worth
Let's make this concrete. Say your store does 10,000 visitors a month with an average order value of $65, and you're currently converting at 1.5%. That's 150 sales and $9,750 in monthly revenue.
If you improve your conversion rate to 2.0% — a half-percentage-point lift — you get 200 sales and $13,000 in monthly revenue. That's $3,250 more per month, or $39,000 more per year, from the same traffic.
You didn't buy more ads. You didn't hire a developer. You just reduced friction.
That's why conversion rate optimization is one of the highest-ROI activities a small store can do, and why understanding your platform's role in it matters. If your platform is adding friction you can't control — slow checkout, limited payment options, no mobile optimization — that's a real cost you're paying every month.
When It Makes Sense to Reconsider Your Platform
Most conversion rate problems are not platform problems. They're offer problems, traffic quality problems, or UX problems you can fix without switching anything.
But there are legitimate cases where the platform is the bottleneck:
- You're on a platform that doesn't support accelerated checkout options (Shop Pay, Apple Pay, Google Pay) and you're seeing high cart abandonment on mobile.
- Your load times are consistently above 4 seconds on mobile and your hosting provider can't or won't fix it.
- You're losing sales because your checkout doesn't support the payment methods your customers actually use (a real issue for stores selling internationally).
If any of those apply, it's worth running the numbers on a migration. A platform switch is a significant project — budget 3–6 months and real money — but if your current setup is costing you a percentage point in conversions, the math can absolutely work out.
If none of those apply, focus on the fundamentals before you touch the platform.
Your Conversion Rate Is a Moving Target — and That's Fine
Here's the encouraging part: ecommerce platform conversion rates in 2024 are not a fixed score you either have or don't. They're a reflection of dozens of small decisions — your product photos, your return policy copy, your checkout flow, your page speed — and almost every one of those decisions is within your control.
The stores converting at 3%+ aren't doing one magic thing. They're doing fifty small things slightly better than average, and they review their data regularly enough to catch problems early.
You don't have to overhaul everything at once. Pick the one friction point you found in your checkout audit. Fix it this week. Measure the result. Then pick the next one.
That's the whole playbook, honestly.
Your next step: Run that checkout audit today — incognito window, real product, real purchase attempt. Write down the three moments that felt clunky. Fix the easiest one before the weekend. You'll be surprised what you find.